 CRM
Dashboard
What you will learn
- Dashboard publication and sharing
- Periods and comparisons
- Contributing records
- Measure definitions
What you need
- A management sign-in
Insights → Dashboards. Select a dashboard, for example Service and delivery overview.
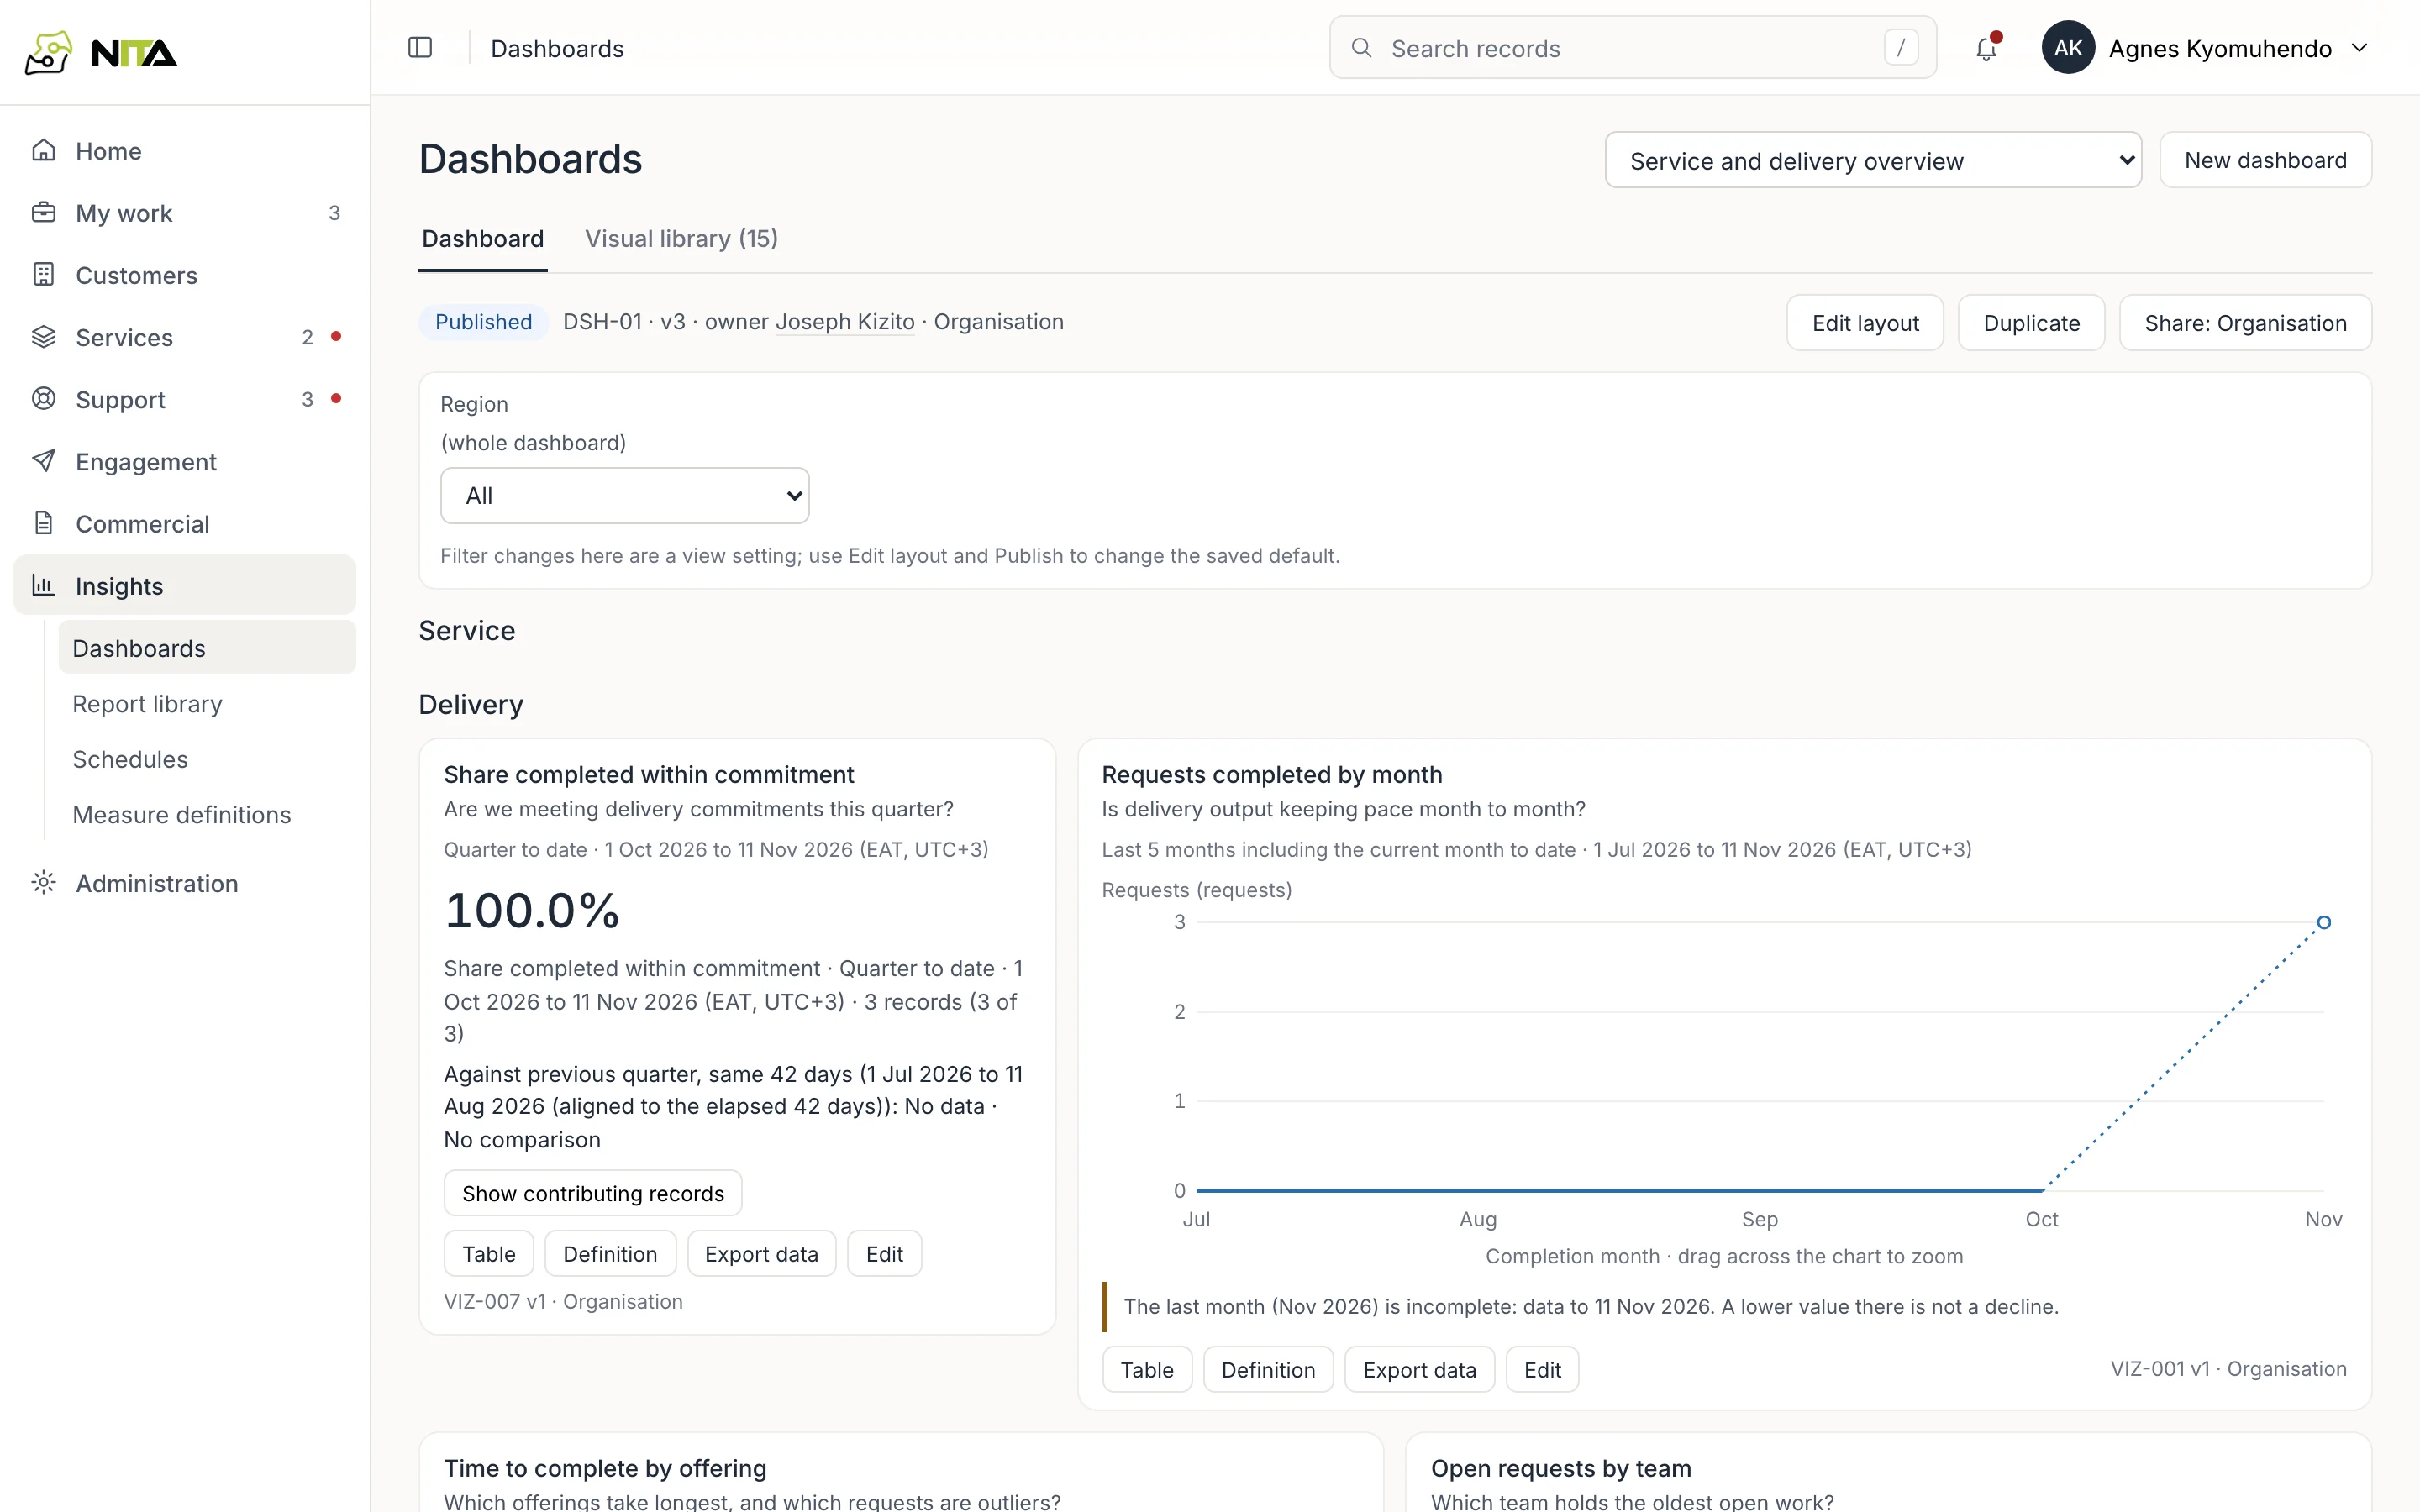
The status line shows publication state, version, owner and sharing. Filters change your view only; the saved default changes through Edit layout and publishing.
Figures
Each visual shows its question, period and time zone (1 Oct 2026 to 11 Nov 2026, EAT), the value and the record count.
Comparisons use the same number of elapsed days in the previous period.
The current month is labelled incomplete.
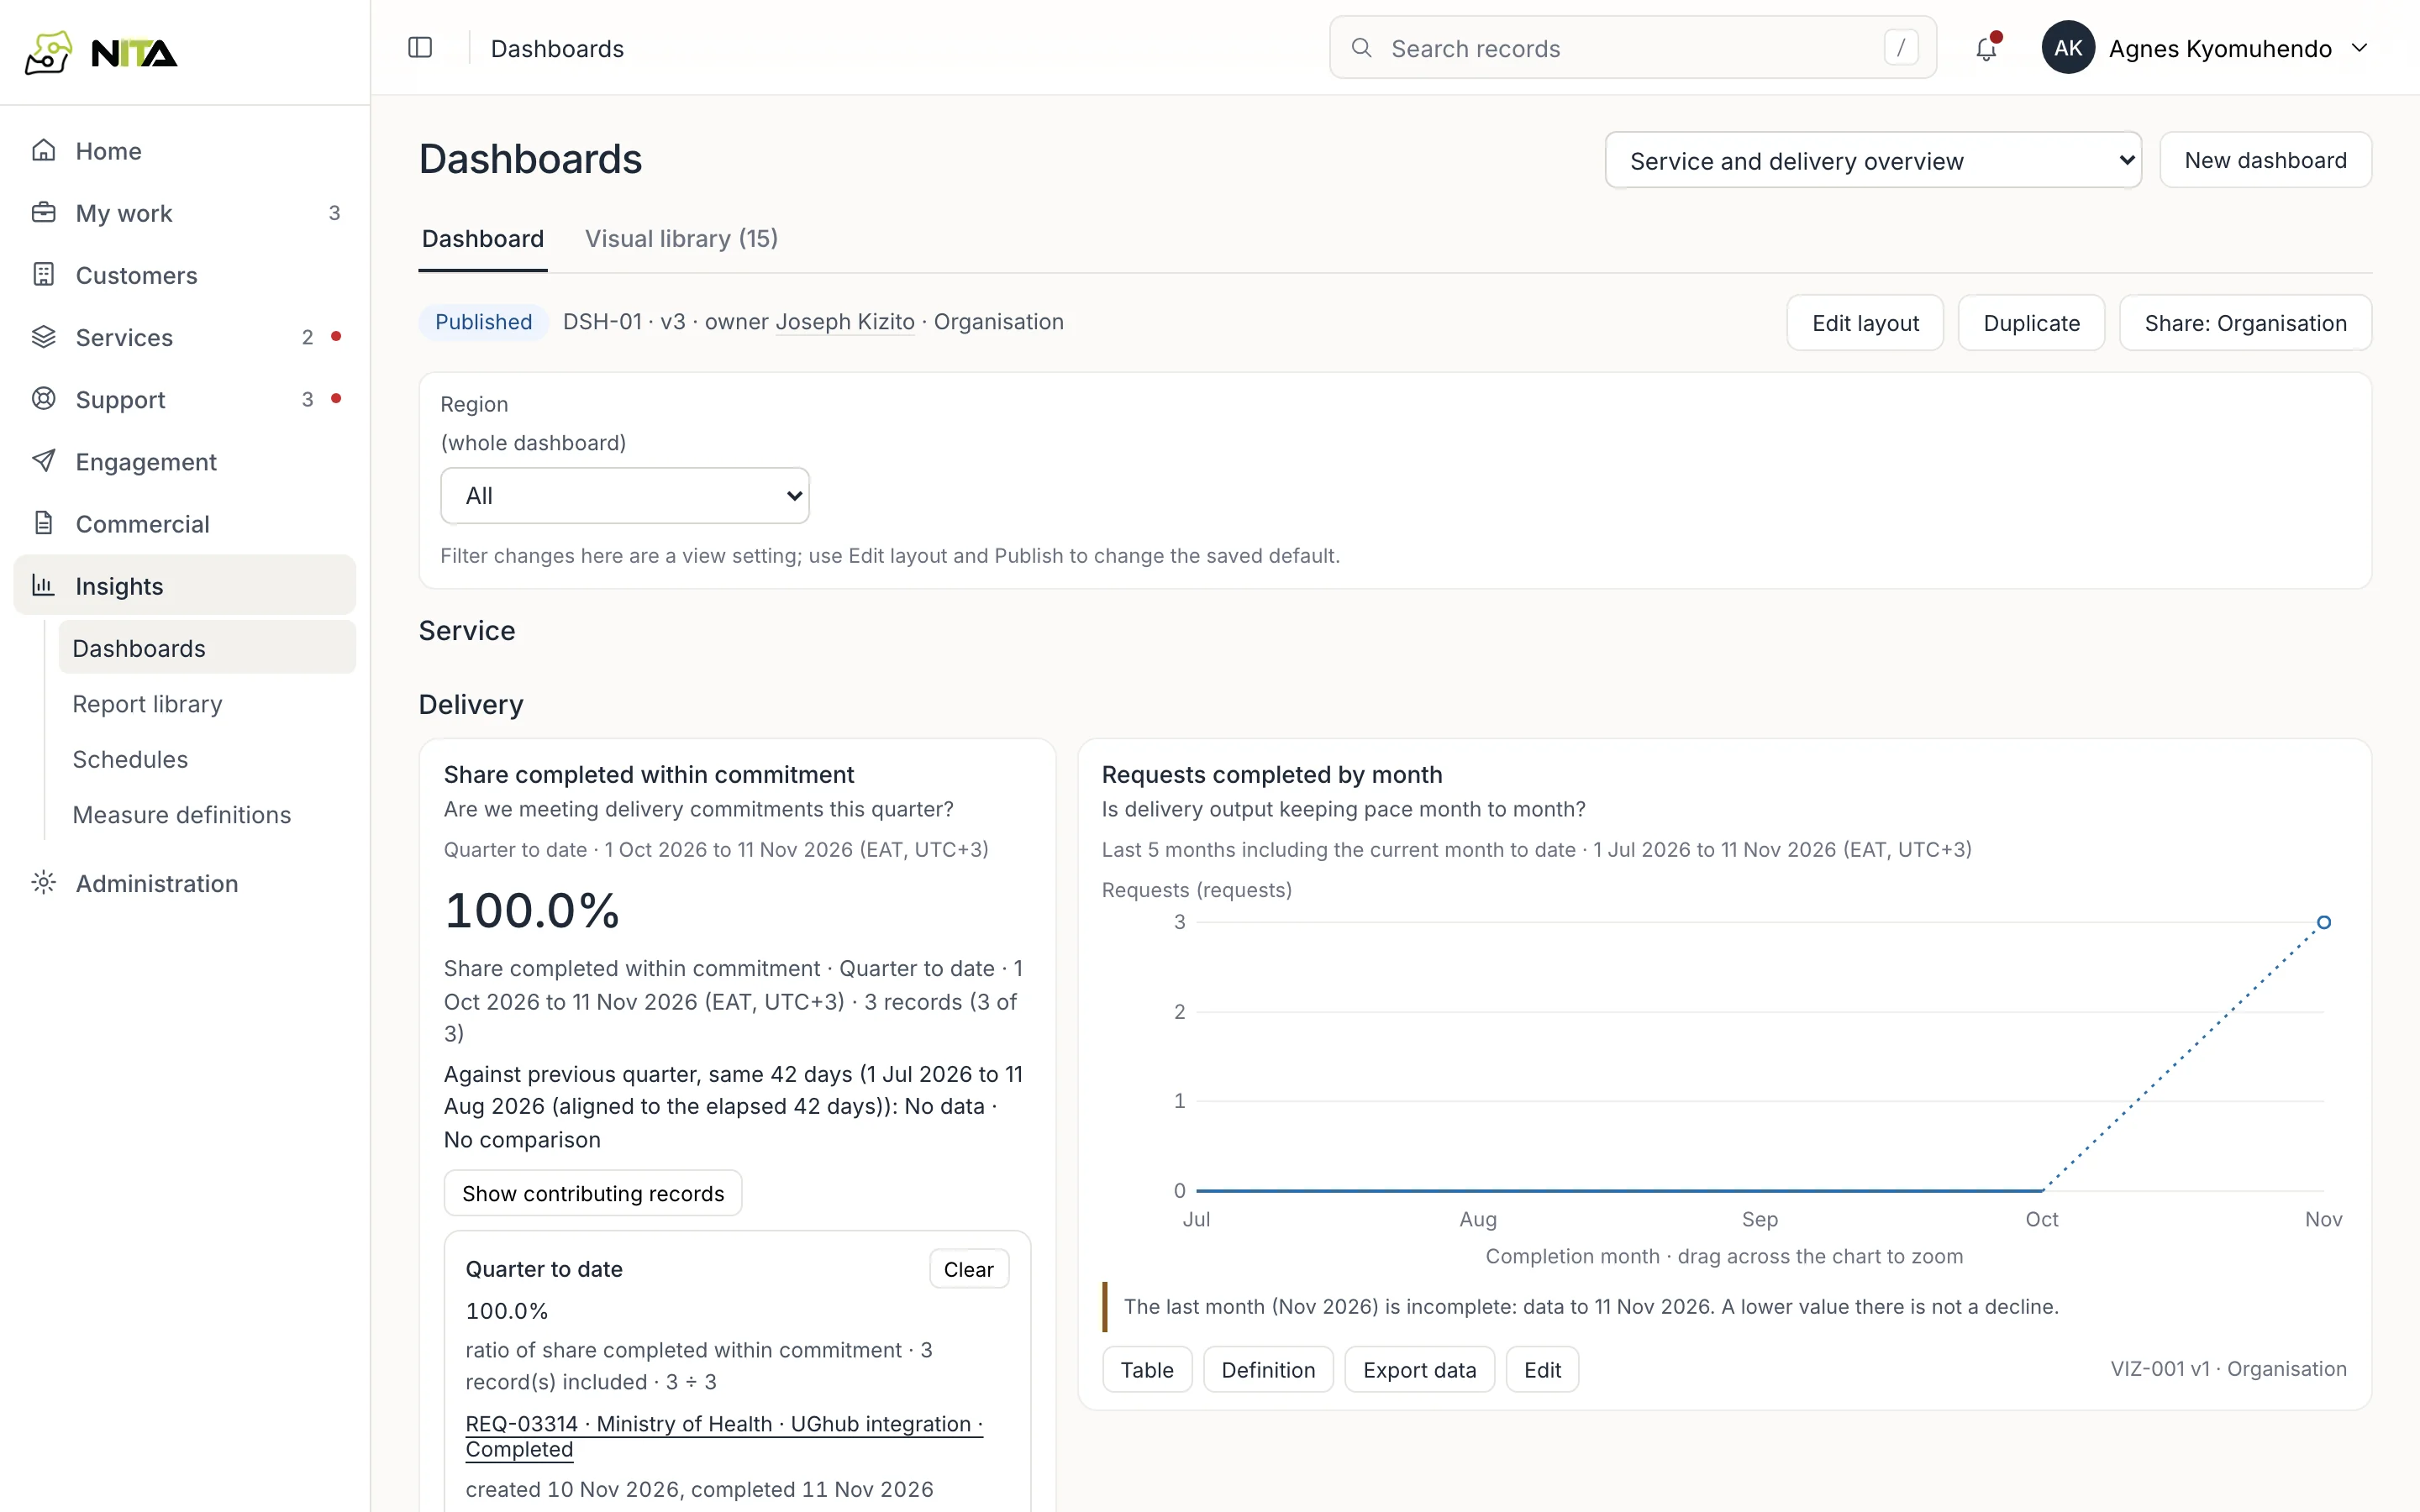
Contributing records
Show contributing records lists the records counted, with links.
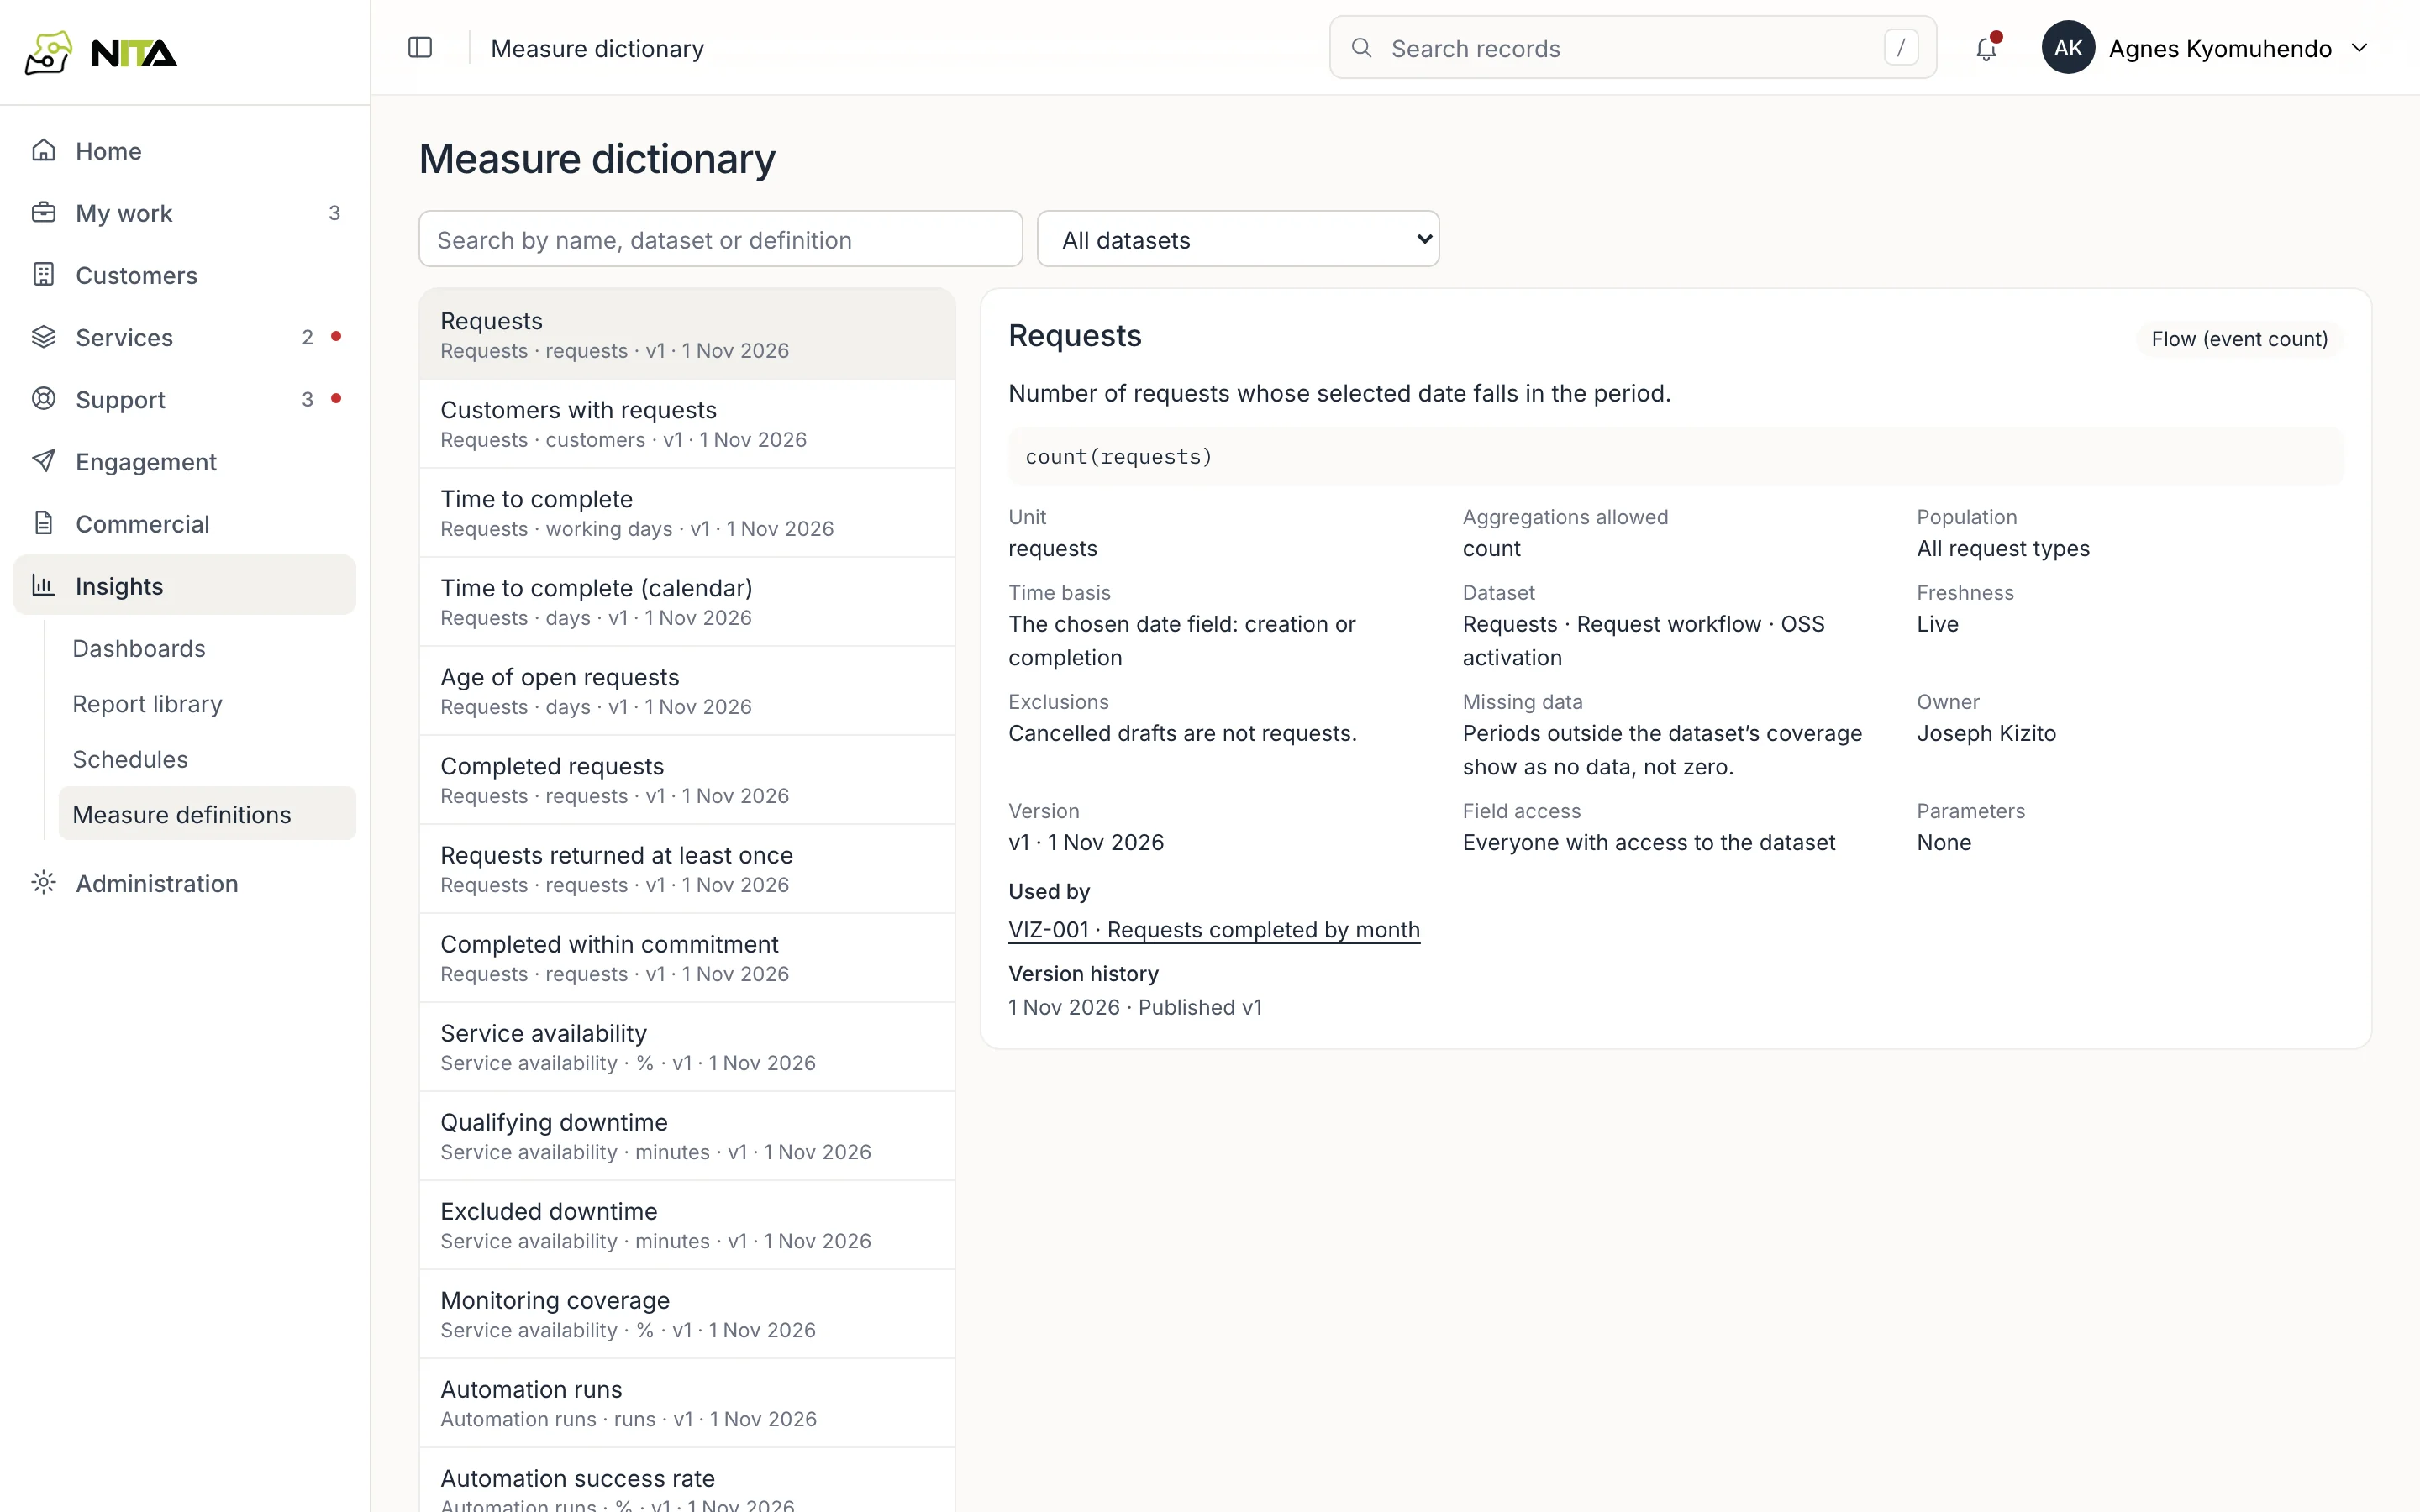
Definition opens the measure: what is counted, exclusions, date field. Measures are listed in Insights → Measure definitions with owner and version.
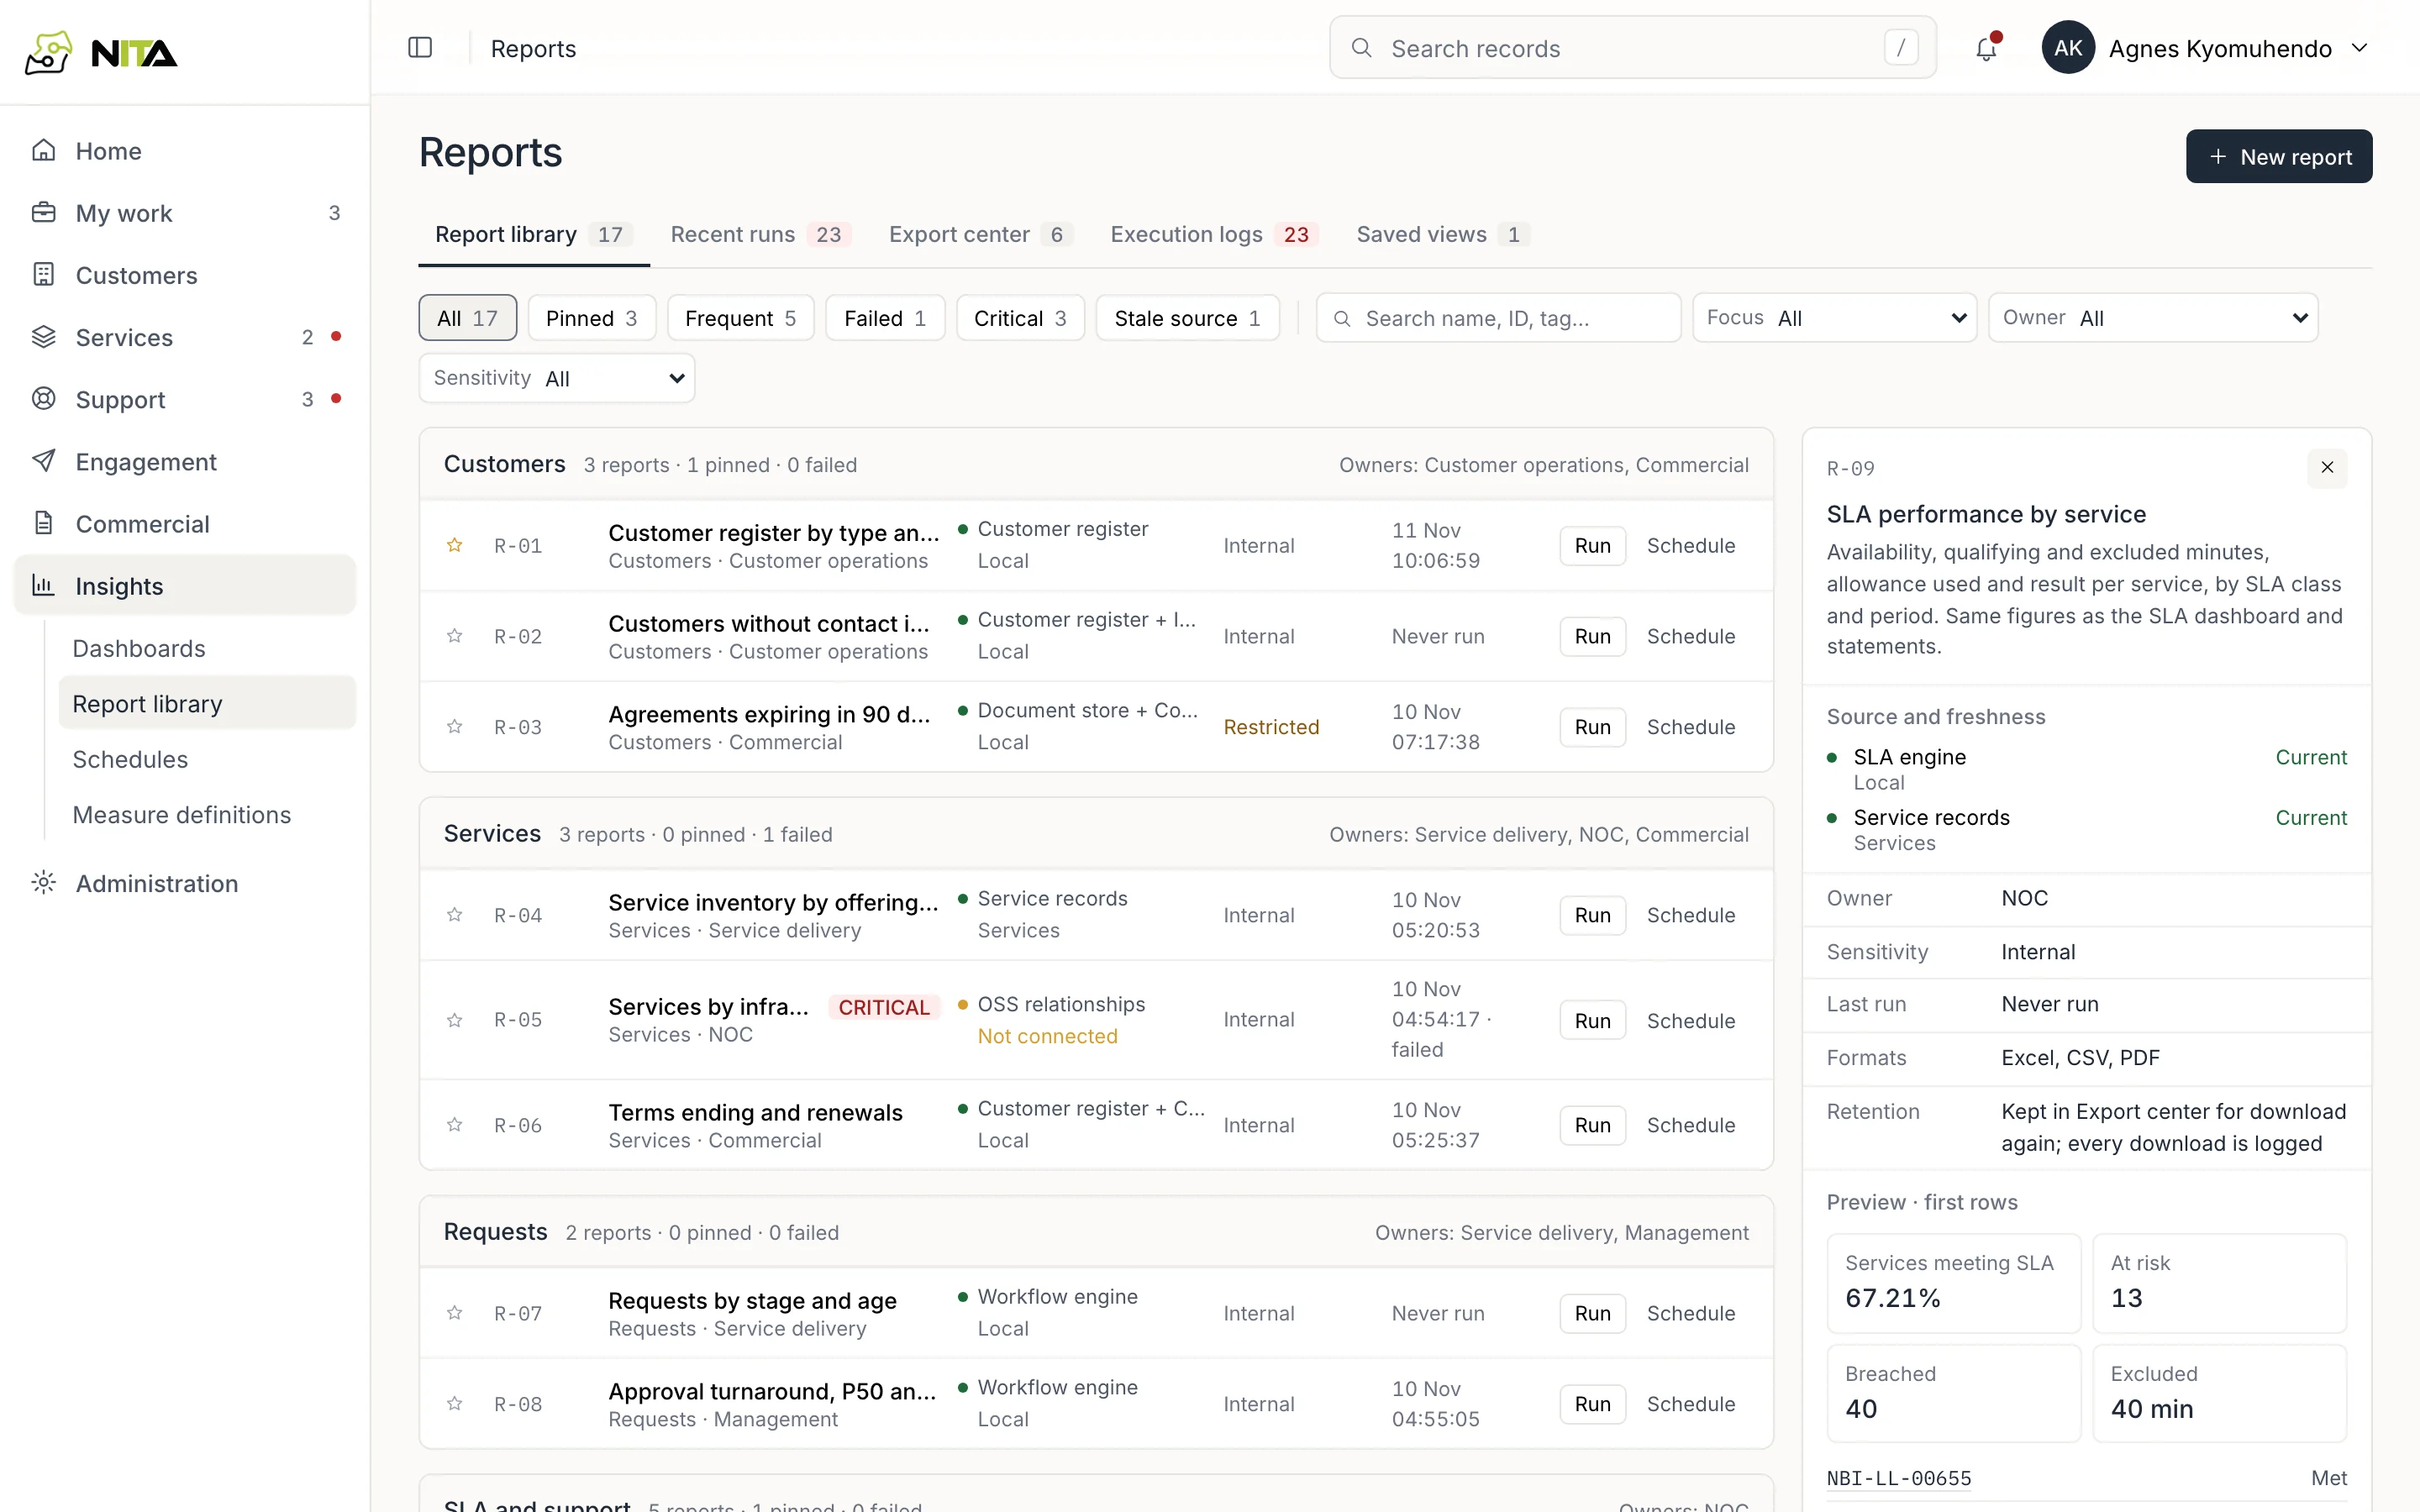
Reports and schedules
The Report library holds tabular reports using the same measures. Schedules emails a report at a set frequency and Kampala time to people with access to it.